
Every payments dashboard features it prominently. The approval rate sits there, usually as a big green percentage, silently judging the health of your checkout flow. We are conditioned to push that number as high as possible: 95 percent feels good, and 99 percent feels like absolute operational mastery. But fixating on that single percentage is a trap that creates a false sense of security. It masks underlying payment failures and subtly encourages decisions that actively harm your bottom line. When you optimize exclusively for a ratio, you inevitably stop optimizing for revenue.
The reality of digital commerce is far more complex than a simple pass-or-fail binary. Behind every transaction lies a dense web of fraud filters, network rules, issuing bank preferences, and temporary system timeouts. Treat all declines as equal, and you leave money on the table. Focus only on pushing your transaction approval rate up, and you might find yourself artificially shrinking your business just to make a chart look impressive.
It is time to rethink how we measure payment performance. We need to move past superficial metrics that look good in a quarterly slide deck, focusing instead on the operational realities of how money actually moves, why transactions fail, and what we can do to intelligently recover lost revenue.
The Problem with Playing the Percentages
To understand why the transaction approval rate is an inherently flawed metric, we first need to look at how it is calculated. In its simplest form, the approval rate is the number of successful authorizations divided by the total number of authorization attempts.
Because it is a ratio, there are two ways to make the number go up: you can increase the numerator (get more approvals), or you can artificially restrict the denominator (attempt fewer transactions). Most merchants choose the latter, often without realizing it. They implement highly restrictive fraud rules, block entire Bank Identification Number (BIN) ranges or geographic regions that historically show lower approval rates, and immediately discard any transaction that looks slightly irregular.

If your primary goal is to maintain a 98% transaction approval rate, dropping slightly risky traffic is the easiest way to get there. But consider the cost of that approach. By filtering out every borderline transaction, you are inevitably blocking legitimate customers who happen to trigger an overly sensitive rule, trading actual realized revenue for a vanity metric. According to data from Signifyd, banks falsely decline roughly 15% of good online orders—a major revenue leak categorized as false declines. A business processing ten million dollars with an 85% approval rate is fundamentally healthier than a business processing five million dollars with a 99% approval rate, provided the underlying fraud and chargeback levels are effectively managed.
Furthermore, a raw transaction approval rate lacks vital context. It treats a $5 micro-transaction exactly the same as a $5,000 enterprise software license, making no distinction between a brand-new customer trying to check out with an unfamiliar device and a loyal subscriber whose card is securely on file. When all data is flattened into a single percentage, you lose the visibility required to make smart optimization decisions.
The Denominator Trap and the Cost of Giving Up
The most damaging side effect of worshipping the approval rate becomes apparent when we look at how businesses handle transactions after they fail. This is a concept often referred to in payment operations as the denominator trap.
The Math Behind the Trap
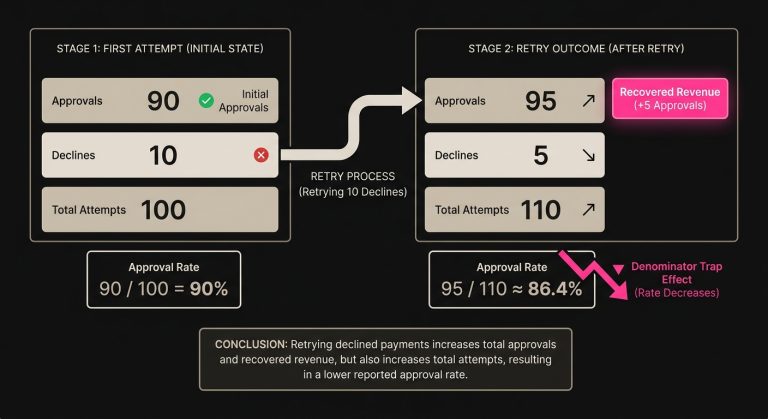
Imagine a scenario where a merchant processes 1,000 transactions in a day. On the first attempt, 900 of those transactions are approved, and 100 are declined. At this moment, the merchant boasts a 90% transaction approval rate.
Now, let’s assume the payment operations team decides to retry those 100 failed transactions three days later, hoping to catch customers after a typical payroll cycle. On the second attempt, 30 of those transactions are approved, and 70 are declined again. The merchant has successfully recovered 30 orders and secured that revenue.
But look at what happens to the core metric. The merchant now has 930 total approvals. However, the total number of attempts is now 1,100 (the original 1,000 plus the 100 retries). The new approval rate is 930 divided by 1,100, which equals roughly 84.5%.
By successfully recovering real revenue and saving customer relationships, the merchant effectively cratered their primary payment KPI. In organizations where teams are evaluated strictly on maintaining high approval rates, the rational behavior is to never retry a failed transaction. They accept the lost revenue to protect the metric, clearly demonstrating how a poorly chosen KPI actively fights against the financial health of the business.
The Impact on Subscriptions and Lifetime Value
The denominator trap is especially devastating for businesses with recurring revenue models. Subscription payment issues are a major driver of involuntary churn. These are situations where a customer loses access to a service not because they wanted to cancel, but simply because the payment infrastructure failed to process their renewal.
When a recurring payment decline hits your system, it isn’t just the loss of a single month’s revenue. It is the sudden truncation of that customer’s entire lifetime value (LTV). If your payment strategy dictates abandoning the transaction immediately to keep your approval metrics pristine, you are bleeding valuable subscribers for the sake of a dashboard widget.
Deconstructing the Payment Processing Flow
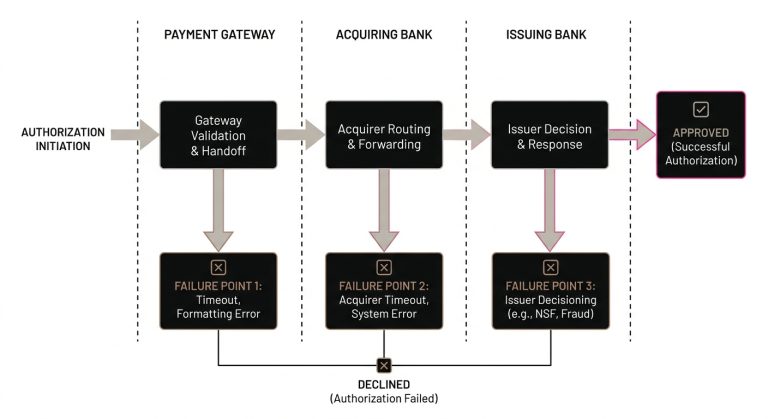
To build better metrics, we have to understand the environment in which these declines happen. A payment authorization is essentially a request for permission that traverses multiple layers of infrastructure in milliseconds. At any point in this journey, the transaction can be halted.
The Issuer’s Dilemma
The ultimate decision-maker in the payment authorization flow is the Issuer—the institution that provided the credit or debit card to the customer. Issuers generally want to approve transactions because that is how they earn network fees. However, they must balance this desire for revenue against strict regulatory requirements, internal risk models, and the cost of absorbing fraud.
Issuers operate on the data they receive. If a transaction arrives with incomplete data, a mismatched billing zip code, or unusual velocity patterns, the issuer’s automated risk systems will likely issue a decline. The challenge for merchants is that the issuer response is rarely descriptive. You might receive a vague decline code or a generic “System Unavailable” message.
These codes do not necessarily mean the customer is a fraudster. They often indicate that the issuer’s risk model wasn’t confident enough to proceed in that specific millisecond, or that the customer temporarily lacked the available balance. A card declined on a Tuesday morning might easily be approved on a Friday afternoon when a direct deposit clears.
The Gateway and Acquirer Layers
Before the transaction even reaches the issuer, it passes through your payment gateway and your acquiring bank. These entities also apply their own layers of risk management and formatting.
Sometimes, checkout issues originate right here. An acquirer might have a temporary outage, or a specific network route might be experiencing high latency, causing the authorization to time out before the issuer can respond. If you treat all declines as a permanent rejection by the customer’s bank, you ignore the reality that the payment plumbing itself is sometimes to blame. Understanding where the transaction failed is just as important as knowing that it failed.
Better Metrics: What to Measure Instead
If the raw transaction approval rate is misleading, what should payment and growth teams measure to actually understand their performance? The key is to break down the payment flow into actionable segments that reflect revenue, recovery, and operational efficiency.
1. First-Attempt vs. Final Resolution Rate
Instead of a single, blended approval rate, split the metric into two distinct numbers. The First-Attempt Authorization Rate measures the health of your initial checkout flow, indicating how well your front-end fraud rules are calibrated and how clean the data is when you first send it to the network.
The Final Resolution Rate measures the percentage of unique orders or billing events that are eventually captured, regardless of how many attempts it took. If an order fails on Monday but is successfully recovered through an automated retry on Thursday, it counts as a success in the Final Resolution Rate. This dual-metric approach removes the denominator trap entirely, allowing teams to aggressively pursue revenue recovery without feeling like they are sabotaging their own performance dashboards.
2. Revenue Recovery Yield
Payment optimization should always tie back to dollars, not just transaction counts. Revenue Recovery Yield measures the exact amount of money saved from the initial pile of declined transactions.
This is where sophisticated platforms focused on payment recovery truly shine. Intelligent payment optimization isn’t about blindly hammering the network with retries. Instead, it involves analyzing the underlying decline codes and using advanced logic to salvage transactions safely. Platforms like SmartRetry operate on this exact premise, helping merchants recover revenue from declined payments by identifying the optimal time to re-engage the network. The goal of this metric is to quantify exactly how much top-line revenue the payment operations team has added back to the business.
3. Cohort-Specific Authorization Rates
A global average hides local problems. To truly understand your payment performance, you need to track authorization rates by specific cohorts.
Break down your metrics by Bank Identification Number, card brand, issuing country, and transaction value. You might discover that your overall approval rate is a healthy 92%, but transactions routed through a specific European issuer are failing at a rate of 40%. Cohort-specific metrics allow you to isolate anomalies and investigate root causes—such as relying on an outdated Merchant Category Code or processing mismatched currencies—rather than staring at a blended average that offers no actionable insights.
4. Good Customer Approval Rate (False Positive Rate)
This is perhaps the hardest metric to quantify, but it is among the most vital: How many legitimate customers are you turning away?
While you cannot know with absolute certainty if a blocked transaction was going to result in a false decline, you can estimate your false positive rate by analyzing customer behavior. If a customer experiences a decline and immediately tries again with a different card that gets approved, the first decline was almost certainly a false decline. By tracking these patterns, you can tune your risk engines to be more forgiving of minor data mismatches from established accounts. Industry estimates suggest that up to 58% of all declined transactions are actually false declines.
5. The True Cost of Payment Failures
Every time you ping the payment network, it costs money. Gateways charge transaction fees, and card networks impose authorization fees regardless of whether the transaction is approved or declined.
To evaluate your payment strategy, you must measure the cost per recovered dollar. If you are blindly retrying doomed transactions, such as a card reported lost or stolen, you are racking up network fees with zero chance of revenue recovery. You also risk harsh compliance penalties from Visa or Mastercard for excessive retries. Measuring the cost of your retries forces the organization to abandon brute-force tactics and adopt intelligent, surgical recovery strategies.
Rethinking How We Handle the Inevitable Decline
Once you adopt these nuanced metrics, your relationship with declined transactions fundamentally changes. You stop viewing a decline as a permanent failure and start viewing it as a state of temporary friction that can often be resolved.
Decoding the Issuer Response
The foundation of any strategy to reduce payment declines is the accurate categorization of the issuer response. Broadly speaking, declines fall into two categories: hard and soft declines.
A hard decline means the transaction is permanently dead because the card is expired, the account is closed, or the card has been reported stolen. Retrying a hard decline is a waste of money and actively harms your reputation with the card networks.
A soft decline is circumstantial. The customer might have insufficient funds, the network could be experiencing a timeout, or the issuer’s risk limit for the day has been temporarily exceeded. These are the transactions where revenue recovery is highly probable if you approach the problem strategically.
The Art of the Intelligent Retry
Timing is everything if you want to retry failed payments successfully. A rudimentary approach is to simply wait 24 hours and try again, while a sophisticated strategy involves analyzing historical data to predict the exact hour the customer is most likely to have funds available.
For example, insufficient funds declines often resolve on the 1st and 15th of the month, aligning with common global payroll cycles. A soft decline returned at 2:00 AM on a Sunday might just coincide with a scheduled bank maintenance window, meaning a retry at 8:00 AM could succeed effortlessly. Intelligent retry strategies consider the specific decline code, the time of the original failure, the geographic location of the issuing bank, and historical success patterns to calculate the precise moment to re-attempt the authorization.

Leveraging Network Tools
Intelligent payment optimization also requires utilizing the tools provided by the card networks themselves. Account updater services automatically fetch new expiration dates and card numbers when a subscriber is issued a replacement card, proactively preventing the decline from happening in the first place.
Network tokenization replaces the raw primary account number (PAN) with a secure, merchant-specific token. This token is constantly kept up-to-date by the networks and has historically demonstrated a noticeable lift in authorization rates compared to raw card data. Integrating these tools ensures that when you do submit a transaction, you are giving the issuer the cleanest, most trustworthy data possible, maximizing your chances of success on the first attempt.
Moving from Defensive to Offensive Payment Optimization
For years, the payment industry operated on a defensive mindset. The goal was simply to avoid fraud, avoid chargebacks, and keep the baseline transaction approval rate high enough that executive leadership wouldn’t ask uncomfortable questions.
As customer acquisition costs rise and digital competition intensifies, that defensive posture is no longer sufficient. Payments must be viewed as a growth engine. Every percentage point of revenue recovered from the decline pile drops straight to the bottom line, and every subscriber saved from an involuntary cancellation extends lifetime value while improving overall business profitability.
To make this shift, we have to let go of the simplistic, blended transaction approval rate and embrace the complexity of the payment processing flow. By measuring first-attempt resolution, tracking revenue recovery yield, deeply understanding issuer behavior, and deploying data-informed, automated retry strategies through platforms like SmartRetry, organizations can stop playing mathematical games with their dashboards. Instead, they can transition to a strategy that actually reflects reality—one built on maximizing safe, sustainable revenue and ensuring that no legitimate customer is ever left behind due to a solvable technical glitch.